Open source
Open-source tools for large data and time series.
Five projects for interactive visualization and analysis of large data and time series: FlexViz, plotly-resampler, tsflex, tsdownsample, and argminmax. All developed in the open, on GitHub.
Our mission
Interactive exploration of large data, made ordinary.
Two shifts at once: datasets are outgrowing the tools people use to visualize them, and the people doing that work now do it alongside a coding agent. The projects on this page address the first; FlexViz addresses both.
Make visualizing large data ordinary
No sampling, no waiting, no giving up on interactivity. Seeing all of your data, and moving through it freely, should be the ordinary case at 100M+ rows. That runs through every project here, from the SIMD kernel up to the dashboard.
Make that exploration agent-native
The direction the newer work takes. A coding agent builds the dashboard and reads your live view back as state, not a screenshot, then reasons over the rows behind it. FlexViz is where that is built today.
What we believe
- 01
Visualize all your data
A sample hides the outlier you were looking for. The tools aggregate the full dataset for the current view instead, so nothing is dropped before you see it.
- 02
Interaction beats an image
A picture cannot be zoomed or brushed. Exploration is about changing the view and getting an honest answer back, live.
- 03
Open by default
Every tool on this page is open source and stays that way. Permissive licenses, public issue trackers, and peer-reviewed papers behind the algorithms.
How the tools relate.
Solid arrows are code dependencies. The dashed arrow is not: it is what FlexViz carried over from plotly-resampler, which it does not import a line of.
- argminmax is the SIMD kernel used by tsdownsample, Polars its
arg_minandarg_maxfunctions, and FlexViz’s own Polars plugin. - tsdownsample carries no dependency on any plotting library. That is why besides plotly-resampler, also HoloViews and hvPlot use it as well: their
downsample1doperation accelerates LTTB with it, and its minmax, minmax-lttb and m4 algorithms are unavailable without it. - tsflex is the sibling project, used for processing and window-based feature extraction rather than for plotting.
FlexViz
FlexViz is our open-source engine for interactive data exploration at scale, and the project the consulting work is built on. Zoom, brush and linked hover are answered by lazy Polars aggregations and Rust kernels, so only the aggregate reaches the browser.
The server is stateless and every view is a URL: viewport, selections, cross-filter mode and layout all encode into the link. Ten trace types are supported, from line and histogram to correlation heatmap and geo 2D histogram. Parquet larger than memory streams through the same lazy plan, so a billion rows explore in under 400 MB of resident memory.
It is agent-native. A coding agent writes the dashboard spec, hands over the URL, and reads your zoom and selections back as state, so you both work against the same live view.
import polars as pl
from flexviz import Dashboard

lf = pl.scan_parquet("readings.parquet")  # 100M rows, lazy

dash = Dashboard(lf)
dash.add_figure().add_line(x="timestamp", y="value")
dash.add_figure().add_histogram(x="value", bins=50)
dash.show()  # cross-filtered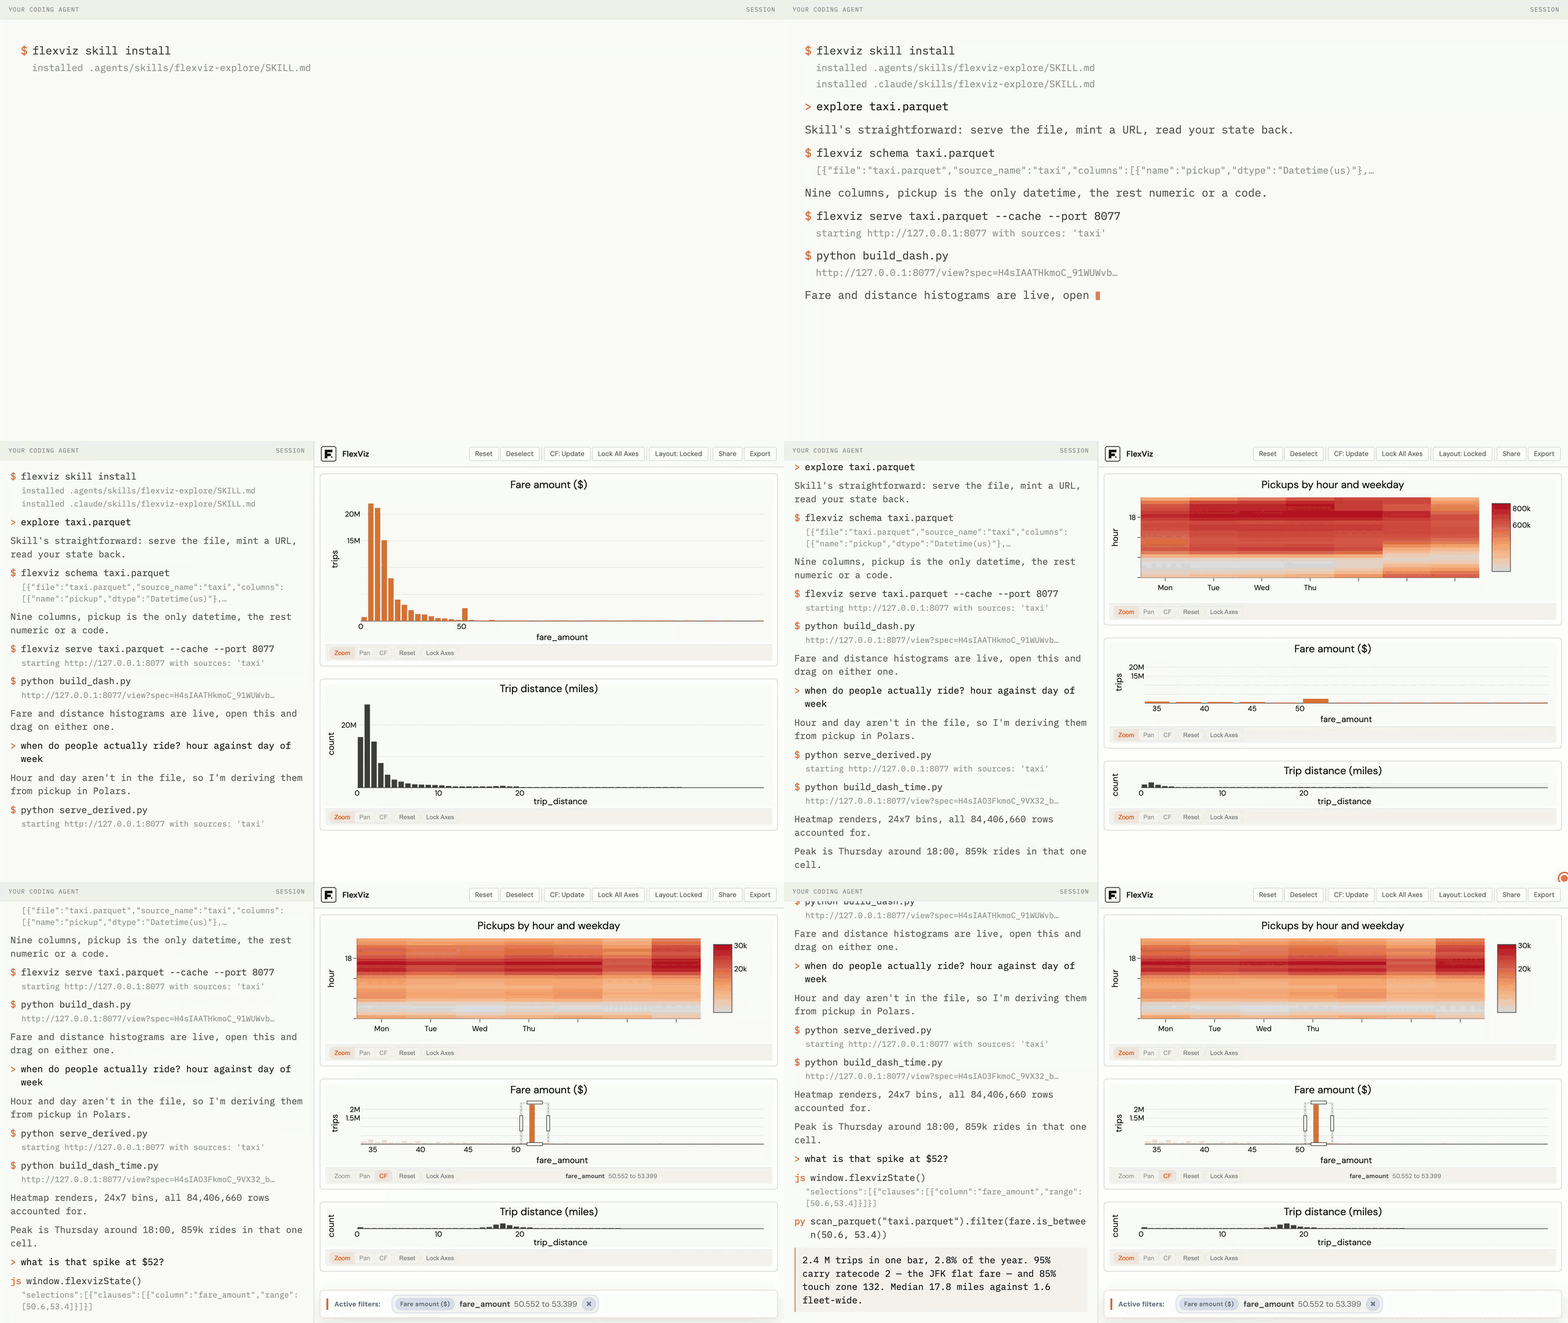
plotly-resampler visualizes large time series with plotly.py. Wrapping a figure in FigureResampler keeps the high-frequency series in Python and sends only a view-aware aggregate to the browser.
Every zoom and pan triggers a new aggregation over the visible window, through a Dash callback or through the FigureWidget in a notebook. The default aggregator is MinMaxLTTB from tsdownsample.
The approach was published at IEEE VIS 2022.
from plotly_resampler import FigureResampler

fig = FigureResampler(go.Figure())
# hf_ data stays in Python, never in the browser
fig.add_trace(go.Scattergl(name="sine"), hf_x=x, hf_y=y)
fig.show_dash(mode="inline")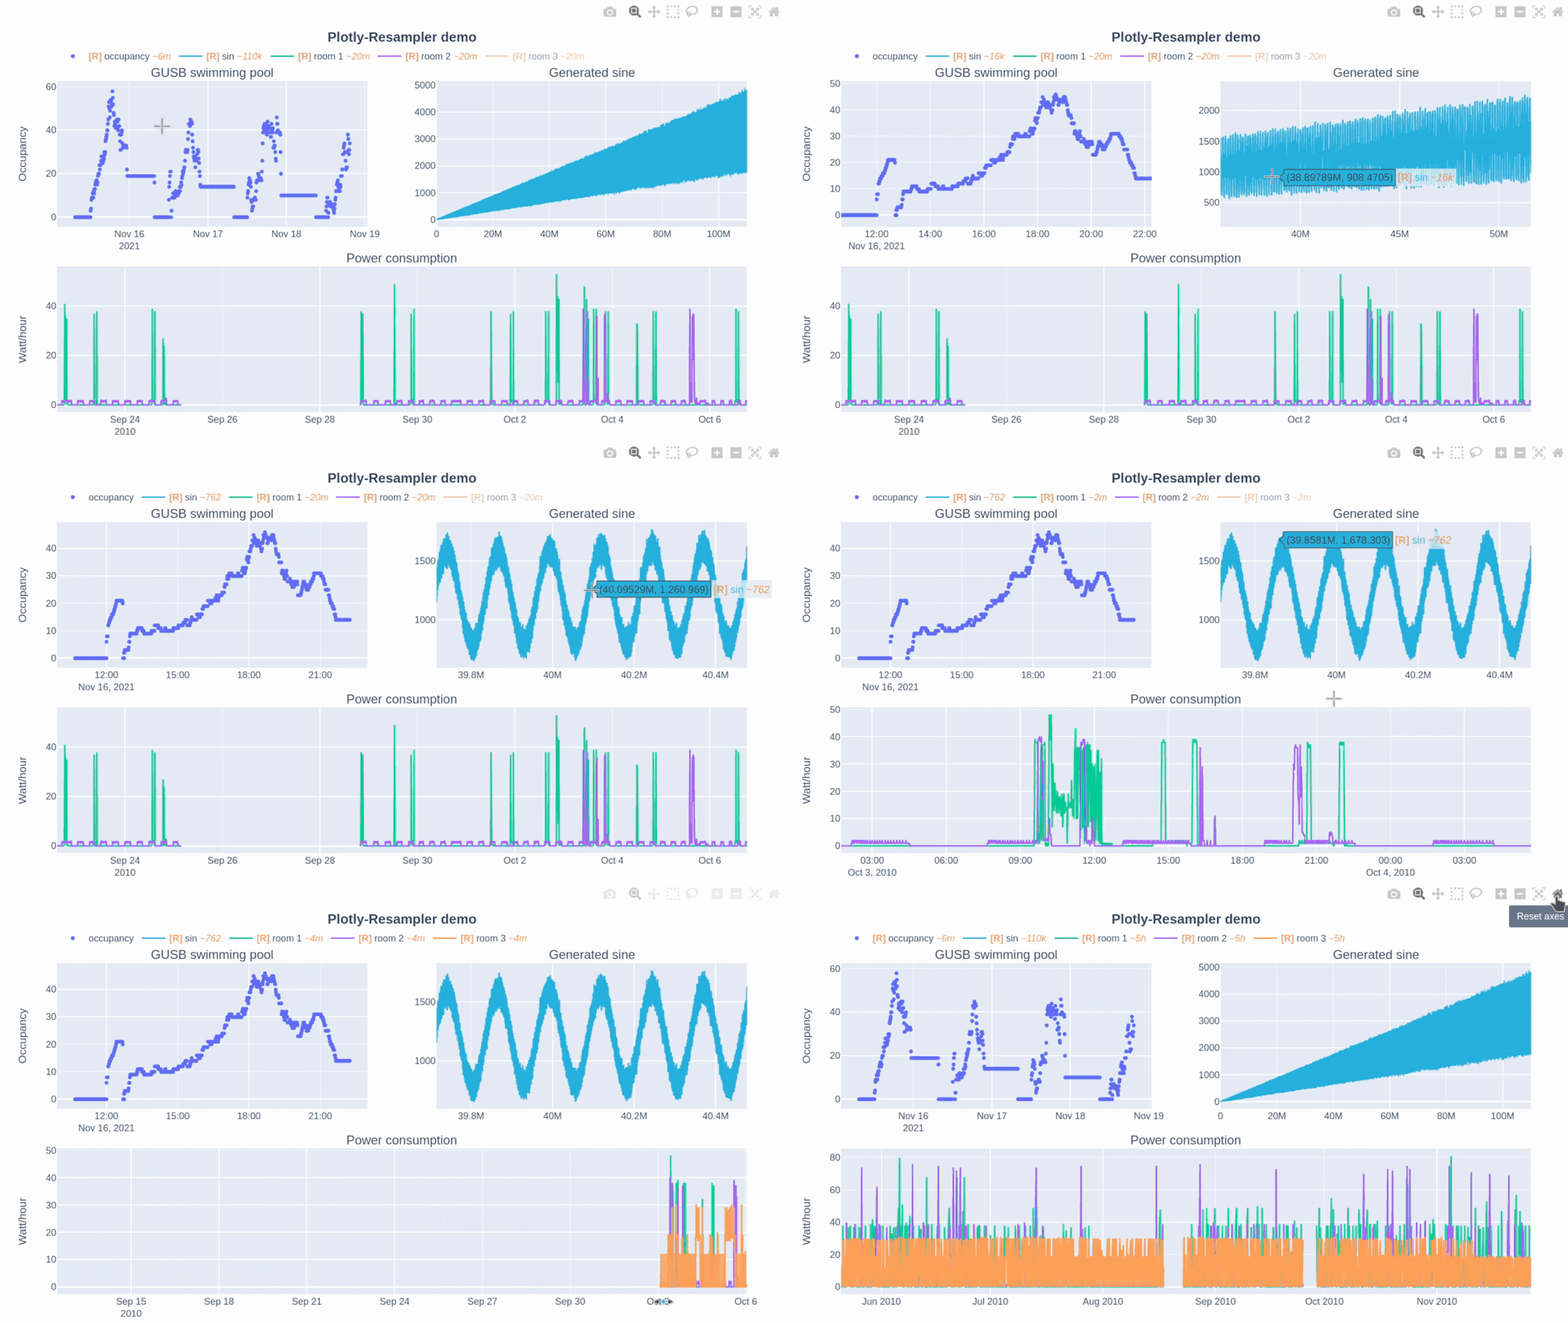
tsflex processes time series and extracts features from them. A FeatureCollection describes which functions run over which series, in which windows and at which strides, and calculates the whole set in one call.
It makes few assumptions about the sequence data. Input can be multivariate with a different sample rate per series, the time index may be irregular or asynchronous, and one collection can hold several windows and strides at the same time.
Feature functions come from the libraries you already use: numpy, scipy, seglearn, tsfresh and catch22 all plug in. Published in SoftwareX 2022.
import numpy as np, scipy.stats as ss
from tsflex.features import (FeatureCollection,
                             MultipleFeatureDescriptors)

fc = FeatureCollection(MultipleFeatureDescriptors(
    functions=[np.min, np.mean, np.std, ss.skew],
    series_names=["TMP", "ACC_x", "IBI"],
    windows=["15min", "30min"], strides="15min"))

features = fc.calculate(data=[df_tmp, df_acc, df_ibi])
tsdownsample
tsdownsample selects the data points that represent a long series in a fixed number of pixels. It is written in Rust and exposed to Python through PyO3, and it returns indices, so the caller keeps its own arrays.
SIMD comes from argminmax with runtime CPU feature detection, and the algorithms are multithreaded with Rayon. They operate on views instead of copies, x is optional, and datatypes from f16 to u64 and datetime64 are supported.
from tsdownsample import MinMaxLTTBDownsampler

# returns indices into y, not a copy
idx = MinMaxLTTBDownsampler().downsample(x, y, n_out=1000)
argminmax returns the index of the minimum and the index of the maximum of an array from a single function. The inner loop is SIMD (SSE, AVX2, AVX512, NEON) and branch-free, so the best and the worst case take the same time. Runtime CPU feature detection picks the implementation, so one binary runs on every CPU.
tsdownsample sits on this crate because MinMax downsampling needs both extremes of every bucket. One pass reads each bucket once instead of twice.
use argminmax::ArgMinMax;

// one pass, both extremes
let (min_i, max_i) = v.argminmax();
Contributing and support.
Issues and pull requests are welcome on the repositories above. A bug report with a small reproducible example is the most useful thing you can send, especially for FlexViz, which is pre-1.0 and still moving.
Paid work is separate from that: running these tools on your data, custom traces and aggregations, and time-series analysis. That is what the services page covers.