plotly-resampler
The plotly-resampler tool enhances Plotly its capability to efficiently visualize large time series datasets by dynamically aggregating data based on the current graph view. This ensures responsive updates during user interactions like panning or zooming.
How plotly-resampler works
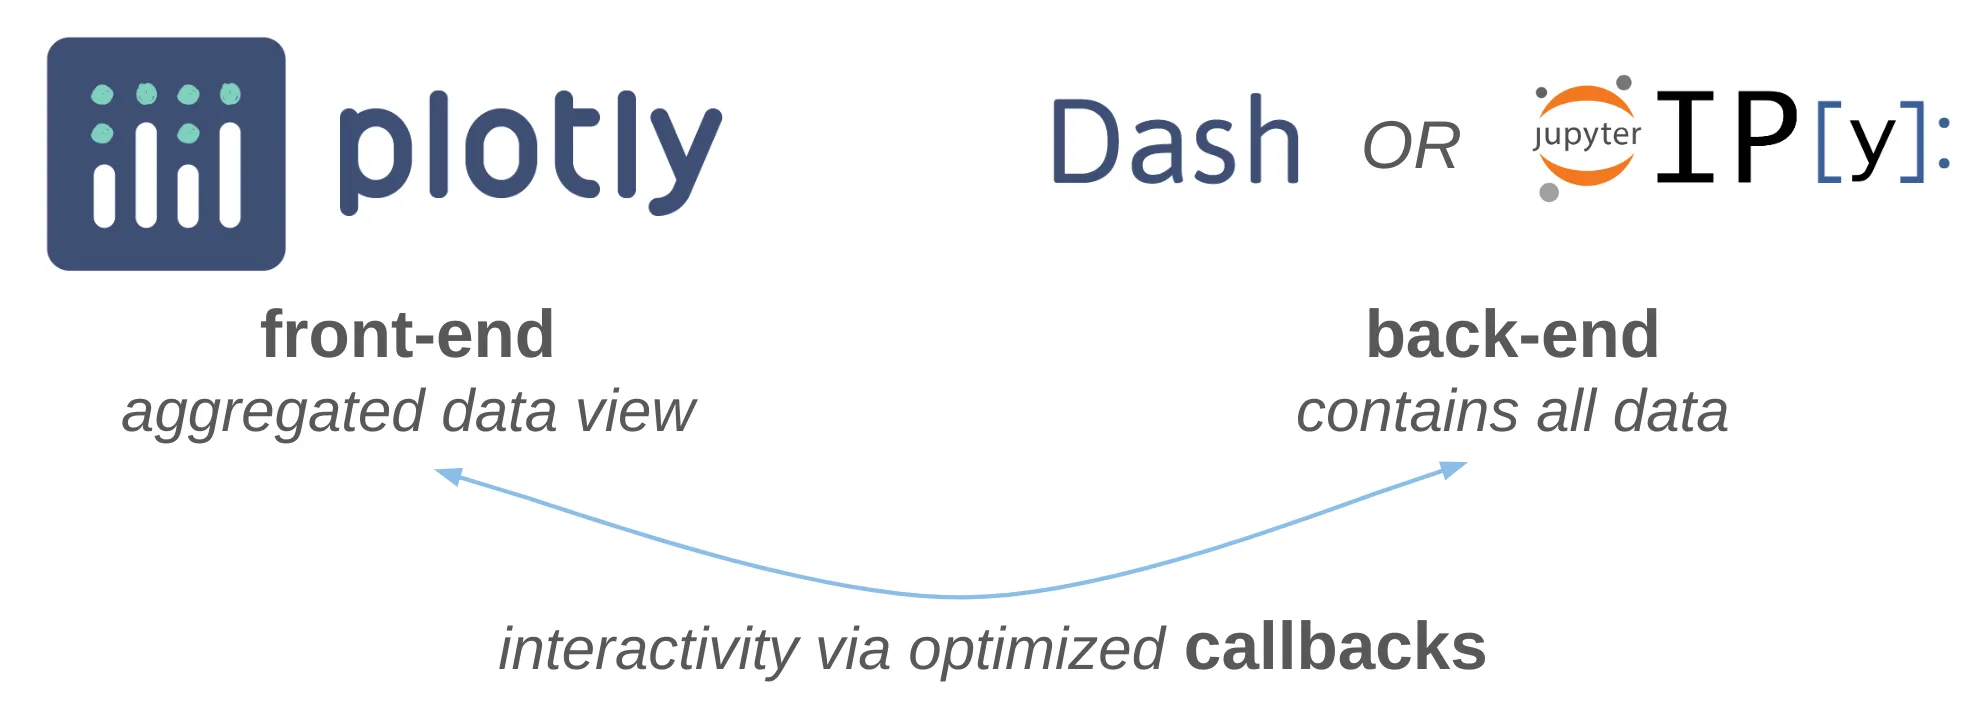
The core functionality leverages optimized time-series data point selection algorithms from the tsdownsample library. These algorithms run in the back-end (where the data is stored) and only load the necessary data points in the front-end (where the graph is displayed). When a user interacts with the graph, such as panning or zooming, the data is dynamically aggregated based on the current view (back-end) and then sent to the front-end for visualization.
Optimizing data aggregation
To optimize data aggregation, we created MinMaxLTTB, a novel algorithm that improves the scalability of the Largest-Triangle-Three-Buckets (LTTB) downsampling by utilizing MinMax prefetching. This algorithm achieves similar visual quality with over 10x faster performance and supports multi-threaded execution.
How to install plotly-resampler
To install plotly-resampler, use the following pip command:
pip install plotly-resampler
How to use plotly-resampler
To use plotly-resampler, wrap the constructor of your Plotly figure with the FigureResampler decorator and call .show_dash() on the figure instead of .show(). This will visualize the Plotly figure within a Dash application that serves the resampling functionality through callbacks.
from plotly_resampler import FigureResampler

# Create a Plotly figure
fig = FigureResampler(data=data, layout=layout)

# Show the figure using Dash
fig.show_dash()
plotly-resampler